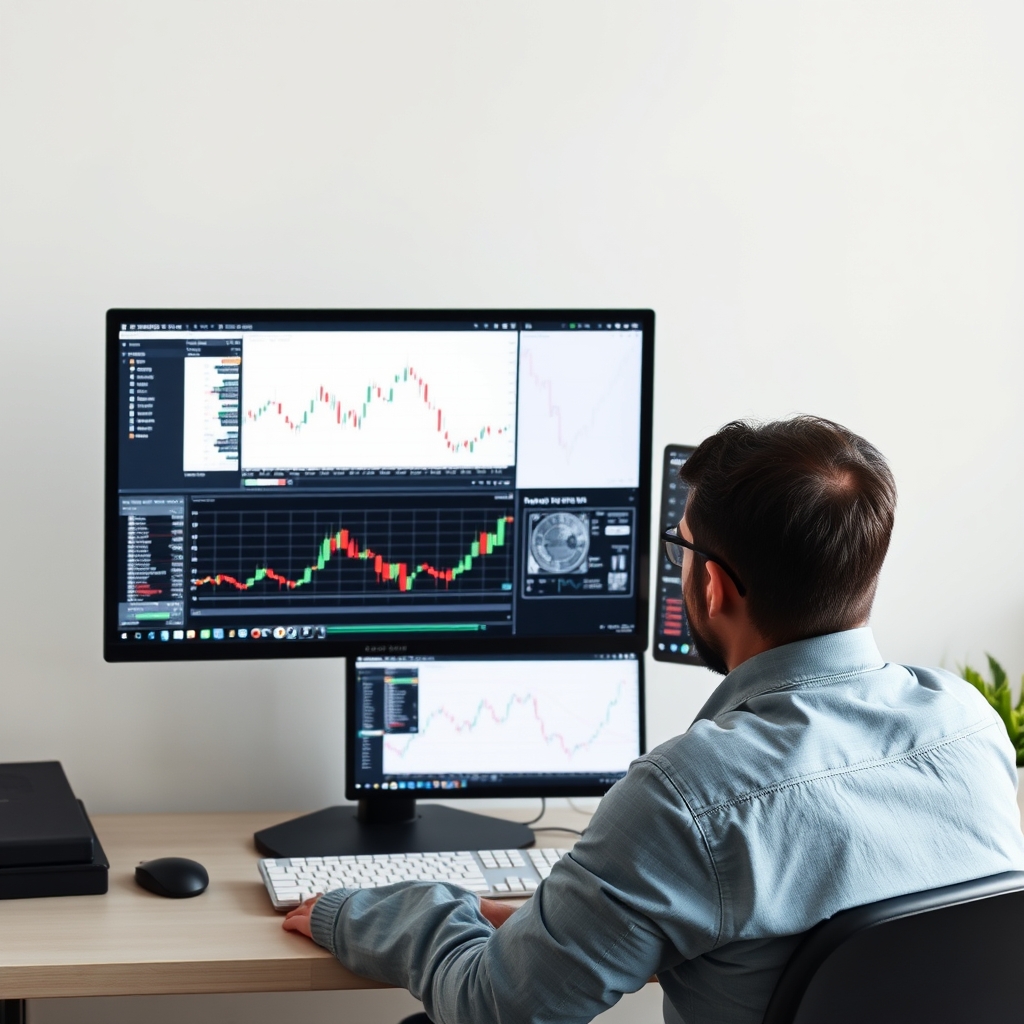
Why Combine Indicators at All?
No single indicator tells you everything. RSI measures momentum, MACD tracks momentum shifts and trend direction, moving averages smooth price to show trend, and Bollinger Bands show volatility relative to recent price. Used together with a clear role for each, they can help you structure decisions. Used carelessly, they just give you five ways to second-guess yourself. None of them predict the future, and no combination guarantees profits.
What Each Indicator Is Actually Good For
Moving Averages: Trend Direction
A moving average tells you whether price has recently been rising, falling, or going nowhere. Price above a rising average suggests an uptrend; below a falling one suggests a downtrend. They lag by design. For setting choices, see What are the best moving average settings for forex trend trading?
RSI: Momentum and Exhaustion
RSI oscillates between 0 and 100. Readings above 70 are often called overbought and below 30 oversold, but in strong trends RSI can stay at extremes for a long time. Treat it as a momentum gauge, not a reversal signal on its own.
MACD: Momentum Shifts
MACD compares two exponential averages. Crossovers of the MACD line and signal line, and changes in the histogram, show momentum strengthening or fading. It is also lagging and can whipsaw in ranges.
Bollinger Bands: Volatility and Context
Bands widen when volatility rises and narrow when it falls. Price touching a band is not automatically a signal; in trends, price can "walk" along a band. Squeezes (narrow bands) show compression, not direction.
The Redundancy Problem
RSI and MACD are both momentum tools built from price, so stacking them mostly repeats the same information. A better approach is one tool per job: trend, momentum, volatility. For more on restraint, read How many indicators should you use on a forex chart?
Two Practical Combinations
1. Trend-Pullback Setup
- Define the trend: price above a longer moving average (for example, one that is clearly sloping up) means you only look for longs; the reverse for shorts.
- Wait for a pullback: look for price to retrace toward the middle Bollinger Band or a shorter moving average.
- Check momentum: RSI cooling toward the middle zone, then turning back in the trend direction, or MACD histogram flattening and then re-expanding.
- Define risk first: place a stop beyond the pullback swing, and size the position so a loss is a small, fixed share of your account.
2. Range-Fade Setup
- Confirm a range: flat moving average, price crossing it repeatedly, MACD hovering near zero.
- Look for edge touches: price at an outer Bollinger Band with RSI near an extreme.
- Require a reaction: wait for a rejection candle rather than entering on the touch.
- Exit plan: target the middle band or opposite side, with a stop outside the range. If the range breaks, accept the loss.
 Recommended for youIs forex scalping profitable?
Comparison: Which Indicator Fits Which Job
| Indicator | Main Role | Weakness | Works Best When |
|---|---|---|---|
| Moving Average | Trend direction | Lags; whipsaws in ranges | Clear trends |
| RSI | Momentum, exhaustion | Stays extreme in strong trends | Ranges, or timing pullbacks |
| MACD | Momentum shifts | Late signals; noisy in chop | Trending markets |
| Bollinger Bands | Volatility context | Band touches are not reversals | Spotting squeezes and ranges |
Honest Tradeoffs
- More confirmation means fewer trades and later entries, which can cost you part of the move.
- Default settings are not magic. Tuning them to past data can produce a system that only fits history.
- Indicators ignore news. Rate decisions and data releases can blow through any setup.
- Timeframe matters. Very short timeframes add noise and spread costs. If you are drawn to that style, read What is the best timeframe for forex scalping? and Is forex scalping profitable? before committing real money.
How to Test Before Risking Money
- Write your rules down: entry, stop, target, and when you will not trade.
- Backtest manually on at least a few dozen historical setups across different market conditions.
- Forward-test on a demo account, then with very small size.
- Keep a journal. Track results and whether you followed your rules.
Leverage magnifies losses, and many retail forex traders lose money. Only trade money you can afford to lose, and consider speaking with a licensed financial professional if you are unsure about your situation.
Choosing Charting Tools
Most platforms include all four indicators, but charting quality, alerts, backtesting and broker costs differ. To see how different approaches and tools line up, visit Forex Trading Strategies and Tool Use Cases. Always confirm current features, pricing and availability on each provider's official site rather than relying on any third-party summary.
The Bottom Line
Pick one indicator per job, learn how it behaves in both trends and ranges, and let risk management carry more weight than the signals. The goal is a repeatable process, not certainty.
Keep reading
 What is the best timeframe for forex scalping?For most traders, the 5-minute chart is a sensible starting point for forex scalping, with the 1-mi…
 What are the best moving average settings for forex trend trading?There is no single best setting, but the most widely used starting points for trend trading are the…
 How many indicators should you use on a forex chart?Most traders do best with two to three indicators on a chart, and rarely more than four. Each one s…